The late, great Donna Summer famously sang, “She works hard for the money, so you better treat her right.” While the Queen of Disco was referring to a helpful bathroom attendant, the lyrics can also be applied to retirement planning.
Earning money is hard! Once you’ve built up some savings, you want to treat it right, so it returns the favor. In other words, you want to invest it in the right places that make sense for you so it continues to grow.
As adults, we learn that stashing money in a piggy bank may not be the most effective way to save for retirement. The insidious power of inflation typically means that cash sitting in a checking account or under a mattress loses value by the day. That is, unless we invest it in places with the goal of outpacing inflation. All of that sounds so simple, right? But doesn’t the risk increase along with the potential reward? Otherwise, why wouldn’t everyone put their money in the same place and await the windfall of earnings?
The bad news is that there’s no such thing as a risk-free investment. The good news is that there are productive ways to potentially lower that risk. As such, today, I’d like to discuss Modern Portfolio Theory (MPT).
MPT’s basic premise is to reduce your overall investment risk and volatility by combining different asset classes into one overall portfolio while, at the same time, optimizing long-term returns. I realize that’s a mouthful. More simply, MPT aims to maximize your earnings while limiting risk in the most efficient way possible.
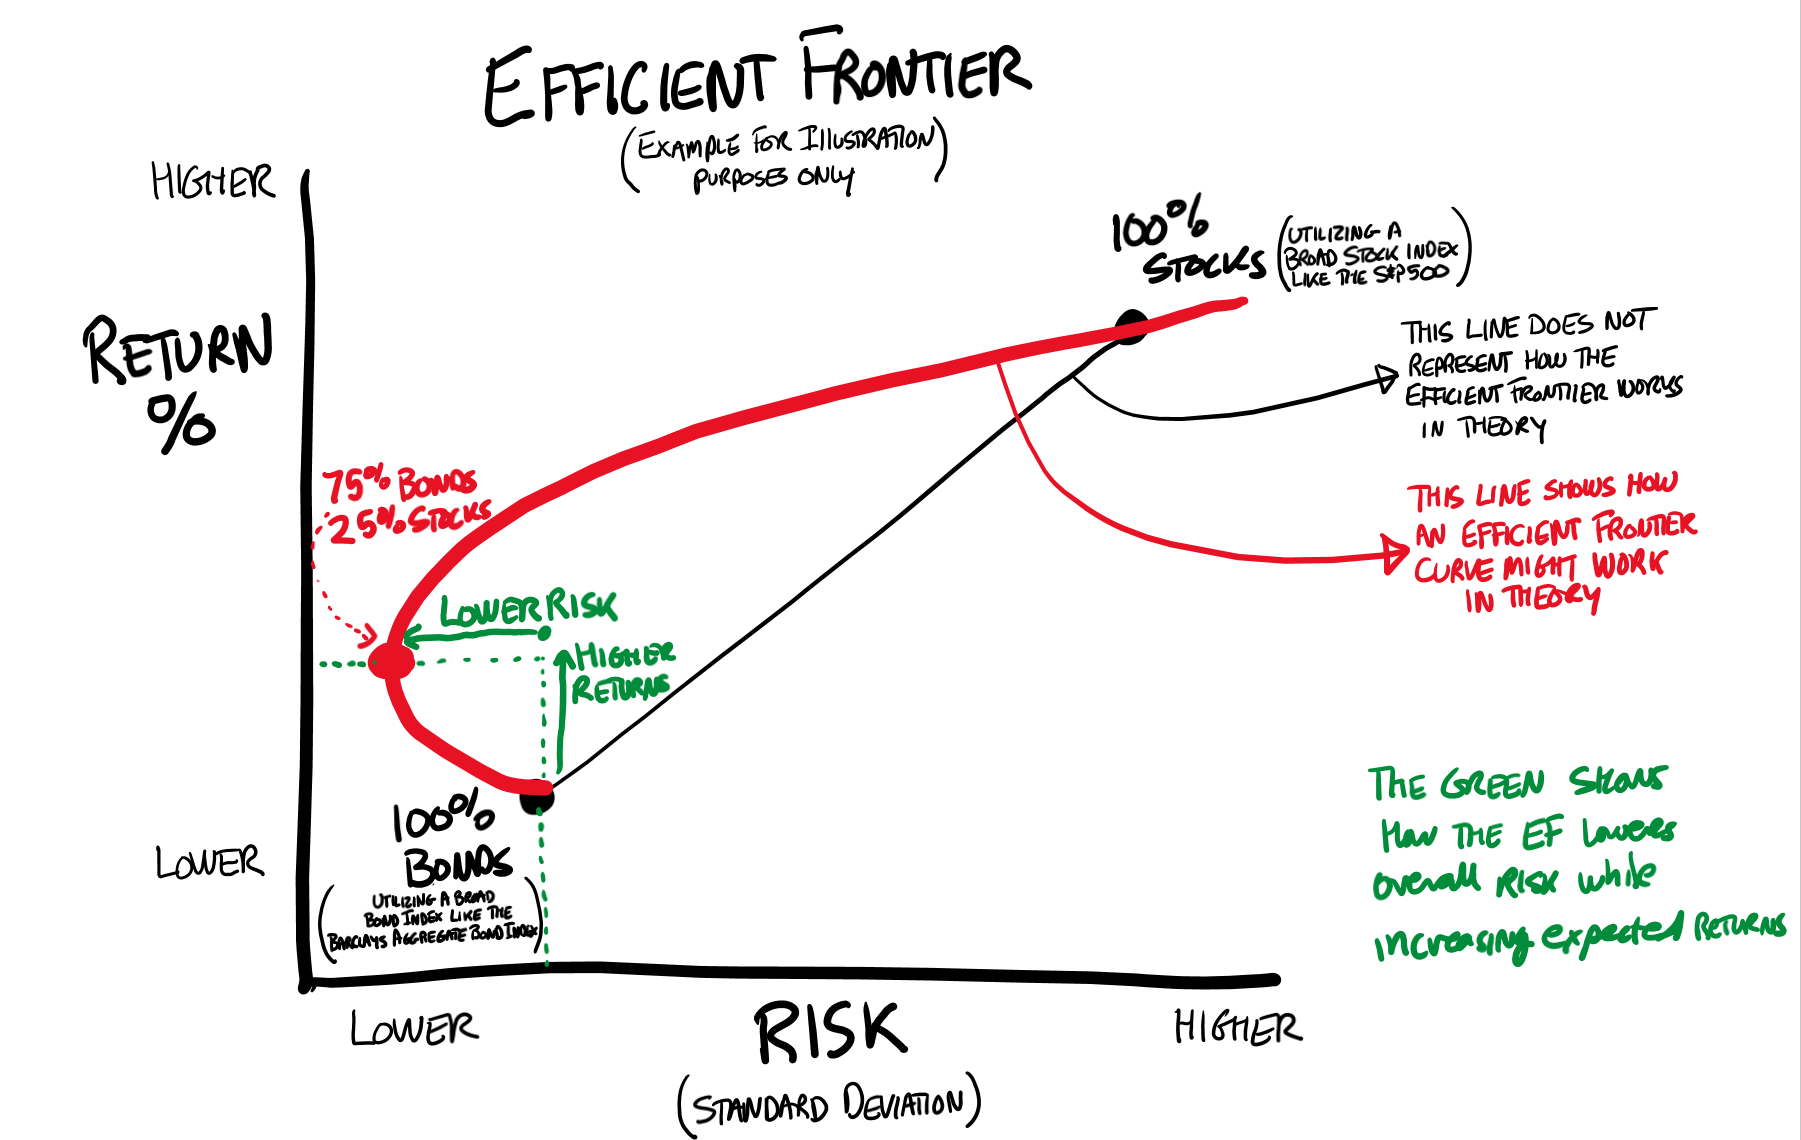
*NOTE: This drawing is for illustration purposes only to demonstrate how the risk/return relationship can operate along a hypothetical efficient frontier mixing stocks and bonds.
The Efficient Frontier
The illustration above shows a red line resembling an upside-down version of Nike’s famous swoosh logo. This swoosh represents the efficient frontier, which plots overall expected portfolio risk relative to expected portfolio returns. As a reminder, standard deviation is sometimes used as a proxy for risk because it measures the range of an investment’s potential performance.
Bonds, considered the more conservative asset class, would sit in the lower left quadrant (generally speaking, bonds are considered to have lower returns, but also lower risk), while stocks would sit in the upper right (generally speaking, stocks are considered to have the potential for higher returns and higher risk). One might assume a direct straight-line relationship would form, with levels of both risk and return increasing along with the number of stocks. However, MPT and the efficient frontier show something very different.
An investor with a portfolio of 100 percent bonds would represent the shorter end of the red swoosh. As stocks were added, the risk-reward trajectory would travel from that short end along its swoosh journey. Notice that on the green line, we see a projection of risk reduction simultaneous to a projection of an increase in return! It doesn’t last forever, but it’s there. For example, the efficient frontier would indicate that the right combination of a 75 percent bond/25 percent stock portfolio would present lower expected risk and higher expected returns than one allocating 100 percent to bonds.
As we continue to add a higher level of risk assets (stocks), we travel further along the swoosh line from the lower left to the upper right of the graph. We see higher liability and a potential for higher returns, but in a more gradual trajectory than we might have seen with a direct straight line. In other words, the efficient frontier potentially offers investors a more optimal way of choosing a portfolio construction with a balance of higher and lower risk investments.
MPT Limitations
Are there limitations to MPT? Indeed, as with anything in life. Mathematics and standard deviation principles might be less important for each investor than sheer portfolio value. So, despite the perceived positives of MPT, certain aspects could be scrutinized during economic downturns. Additionally, there are periods when various asset classes do not necessarily balance each other. For example, in 2022, stocks and bonds were down significantly, which meant neither could offset the other in terms of performance.
Despite its limitations, MPT has the potential to smooth out portfolio returns and limit volatility while also having the potential to deliver long-term earnings. Education is critical before constructing a portfolio to harness MPT — it requires lower volatility characteristics that are understood relative to other options. For instance, comparing an MPT-based portfolio to one allocating a 60/40 standard deviation, as well as the performance of the S&P 500 itself, can help an investor make more informed decisions.
Key Principles of MPT
Key principles include diversification, multiple unique asset classes (stocks, bonds, real estate investment trusts (REITs), master limited partnerships (MLPs), cash, etc.), the trade-off between risk and return, and the efficient frontier. MPT emphasizes the importance of diversifying investments across different asset classes as well as within each asset class. The diversification helps reduce the overall risk of a portfolio by helping to mitigate the impact of any single investment’s poor performance.
MPT recognizes a trade-off between risk and potential return and encourages investors to aim for a favorable level that aligns with their financial goals. It can also play a role in helping to identify portfolios that offer the best trade-off for the investor. Portfolios on the efficient frontier are considered optimal regarding risk-adjusted returns, with the pivotal term being risk-adjusted. The more risk, the less the returns are worth. While asset allocation doesn’t ensure that you earn a maximum rate of return, it does help you maximize your risk-adjusted rate of return — a distinction with a difference.
Examples
To look at MPT in practice, let’s analyze three examples of market returns for a 50 percent stock / 50 percent bond portfolio with an elementary application of asset allocation during some turbulent market years:
-
- In 2002, the S&P 500 dropped 22 percent, while U.S. Treasury bonds were up 15 percent. A 50/50 portfolio was down 3.5 percent.
- In 2008, the S&P 500 was down 37 percent, while U.S. Treasury bonds were up 20 percent. A 50/50 portfolio was down 8.5 percent.
- In 1981, the S&P 500 was down 4.9 percent, while U.S. Treasury bonds were up 8.2 percent. A 50/50 portfolio was up 1.6 percent.
While these market periods were not ideal, investors can take comfort with less volatile returns, helping them to stay invested overall to help reach their long-term goals. Here, participation in very different asset classes helped to offer a buffer against any one major asset class and market decline.
Bottom Line
Like most approaches to finance and life, MPT has its benefits and limitations. So, what is a sensible mix, and how can investors start living on the efficient frontier? Determining an asset allocation approach that is right for you depends on your appetite for risk. If volatility causes you anxiety or you have a shorter target investment horizon, it might be appropriate to consider a more significant percentage in lower standard deviation asset classes like bonds or cash.
More aggressive investors with the stomach and timeframes for higher volatility may favor a more robust blend of equity-like classes such as stocks, REITs, or MLPs. As certain asset classes outperform and underperform, the desired combination may get out of line with your investment objectives. This is why periodic rebalancing is important to keep your portfolio on track.
Planning for retirement can be overwhelming. You work hard for your money, and you want to treat it right. We all do. For some, Modern Portfolio Theory has provided the structure and guidance to balance risk and return effectively. If you’re currently on the hunt for a strategy, it might be worth a look.
This information is provided to you as a resource for informational purposes only and is not to be viewed as investment advice or recommendations. Investing involves risk, including the possible loss of principal. There is no guarantee offered that investment return, yield, or performance will be achieved. Stock prices fluctuate, sometimes rapidly and dramatically, due to factors affecting individual companies, particular industries or sectors, or general market conditions. For stocks paying dividends, dividends are not guaranteed, and can increase, decrease, or be eliminated without notice. Fixed-income securities involve interest rate, credit, inflation, and reinvestment risks, and possible loss of principal. As interest rates rise, the value of fixed-income securities falls. Past performance is not indicative of future results when considering any investment vehicle. This information is being presented without consideration of the investment objectives, risk tolerance, or financial circumstances of any specific investor and might not be suitable for all investors. There are many aspects and criteria that must be examined and considered before investing. Investment decisions should not be made solely based on information contained in this article. This information is not intended to, and should not, form a primary basis for any investment decision that you may make. Always consult your own legal, tax, or investment advisor before making any investment/tax/estate/financial planning considerations or decisions. The information contained in the article is strictly an opinion and it is not known whether the strategies will be successful. The views and opinions expressed are for educational purposes only as of the date of production/writing and may change without notice at any time based on numerous factors, such as market or other conditions,