Imagine you’re at the beach. You’re in the ocean, and you have a beach ball. Now, imagine that you take that ball and push it down into the water. You push it down further and further, and you can feel the resistance building. That’s because the pressure to rise back up for the air-filled ball is becoming greater with every additional inch you push it down.
This is how I conceptualize a falling market, particularly in a good economy – just like that beach ball. As uncomfortable as these stock market corrections are, they often can be the best time to invest.
For those of you saying, “But Wes, I’m already invested!” I get it. So, while this may not be your time to double down, it also probably isn’t the time to be selling and heading for the cash hills.
I understand if you feel like running. We had another difficult week for your 401(k). There were lots of unsettling headlines, like those about mail bombs. We experienced a 600-point one-day drop for the Dow, making it the “worst month for stocks” since 2009. We landed in “correction territory” for the NASDAQ, S&P 500, and the Dow, and have experienced a total loss of $8 trillion since September.
All of these things happened in a week when we get a third-quarter GDP report that shows a 3.5% growth rate, which, by the way, is a phenomenally strong number for an economy our size.
And, let me share my favorite chart of the week to provide some added perspective on this most recent dip and investor scare. This graphic shows that recessions don’t start with zero real interest rates, but rather when we get into the 3%, 4% or higher range. Take a look.
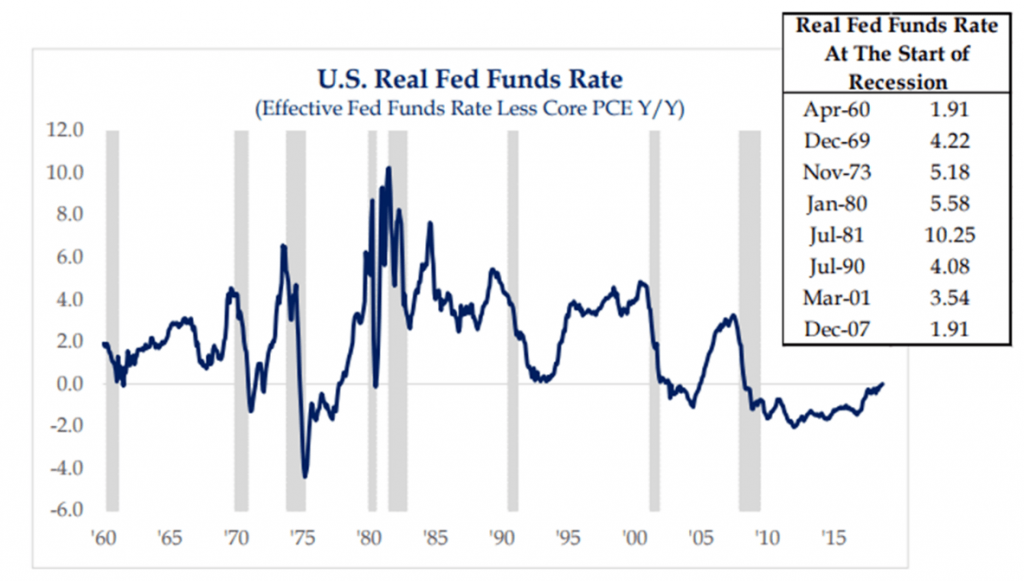
What is “real” in terms of interest rates? It’s the rate you get when you take the nominal rate from the Fed and subtract inflation. In our case right now, the real interest rate is around 2.0 minus 2.0, which gives us zero. At zero, according to historical data, we aren’t near a recession level as far as this critical metric is concerned.
We also know that the economy and stock market don’t always hold hands and move in lockstep. There are plenty of down markets in good economies. Take a look at this next chart, which illustrates how the market and economy can behave differently, or “divorce,” so to speak.
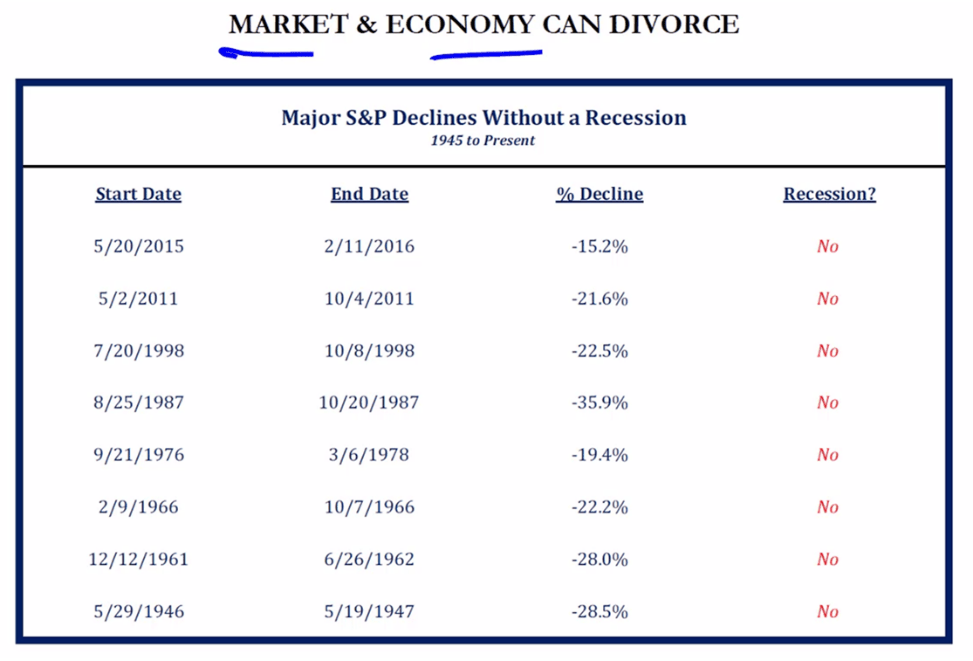
As you can see, in 2015, we were down 15% and didn’t have a recession. Similarly, we were down 21% in 2011 and 19% in 1976, both without a recession.
Remember, investing is a mix between what you think will happen and what you can tolerate actually happening. Based on historical data of past economic and market behavior, this most recent correction is likely more buyable, not less. And, investors are rewarded when they stay the course, with the stock risk they have and choose to take.
This seems, for now, to be the point when selloffs become attractive; we are experiencing approximately 50% of S&P 500 companies in a -20% position. If we look back over the course of past corrections, that’s the level that typically starts to mark a turning point. Basically, stocks go on sale – a massive clearance of such scale that it brings in droves of new buyers. And, then, returning to our analogy above, our beach ball rises back up again.