
Typically, the stock market dominates headlines while the bond market receives little attention, but that is not the case in 2022. The S&P 500 Index (S&P 500) crossed into “Bear Market” territory in mid-June. After a short-lived bounce through mid-August, it has swiftly come back down to the mid-June level closing at 3,693 this past Friday, September 23rd. And as if that wasn’t enough, bonds which generally serve as a buffer to shield investors from equity volatility have not provided much-needed relief. In fact, it’s nearly the opposite.
From December 31, 2021, through September 23, 2022, the S&P 500 and the Bloomberg Aggregate Bond Index (Bloomberg Agg) are down -23% and -14% respectively. We like to use the Bloomberg Agg as our proxy for bond performance due to its composition of investment-grade government and corporate bonds. Applying a traditional 60% stock / 40% bond portfolio allocation to these returns results in a 60/40 mix down -19%, seemingly leaving investors, “nowhere to hide.” After decades of protection should investors in the heat of the moment simply cut bait and jettison bonds from their portfolios? In my opinion, no.
“In the midst of every crisis, lies great opportunity.” – Albert Einstein
Let’s begin with the first part of this quote and ask, is this a crisis? For stocks, in my opinion, no. For bonds, in my opinion, yes.
To understand why let’s put emotion on the shelf for a moment and look at the data.
The two charts below summarize 45 full calendar years of data from 1977 to 2021. The 2022 data is through September 23, 2022. The gray bars represent the annual total return by calendar year. The red dots represent the largest intra-year market drop from a peak to a trough during the calendar year.
S&P 500 Intra-Year Declines vs. Annual Returns
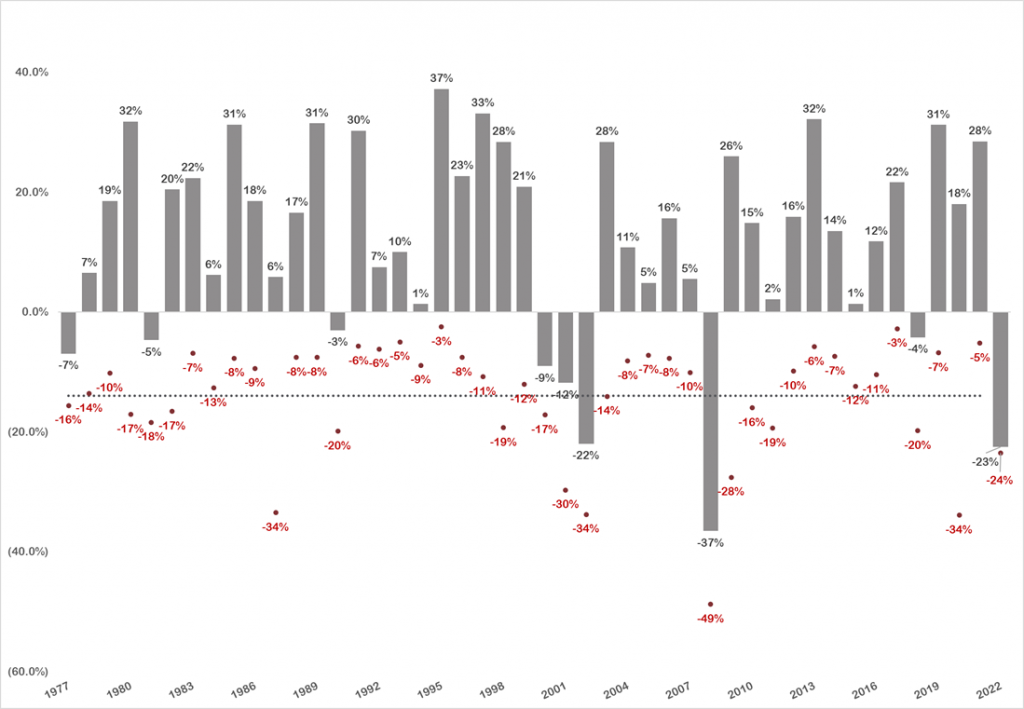
Source: Bloomberg; NYU Stern Database
S&P 500 Summary Points from 1977 to 2021:
- -14.0% Average Intra-Year Decline (Min: -3% | Max: -49%)
- -10% or greater Intra-Year Decline in 25 of 45 years
Bloomberg US Aggregate Bond Index Intra-Year Declines vs. Annual Returns
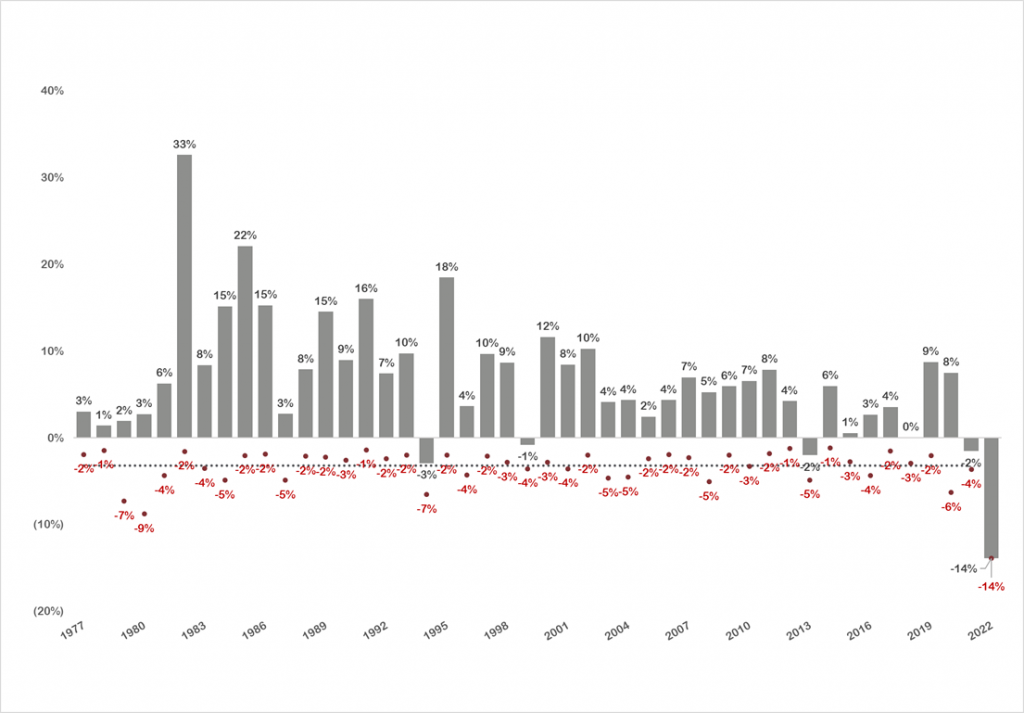
Source: Bloomberg
Bloomberg Agg Summary Points from 1977 to 2021:
- -3.2% Average Intra-Year Decline (Min: -1% | Max: -9%)
- -10% or greater Intra-Year Decline in 0 of 45 years
Just look at these two charts. Over the past 45 calendar years, the S&P 500 has experienced an average intra-year drop of -14.0%. Digging deeper into the data, we see intra-year drops greater than -10% occurring 56 percent of the time (25 of 45 years), greater than -20% occurring 13 percent of the time (6 of 45 years), greater than -30% occurring 9-percent of the time (4 or 45 years) with a maximum intra-year decline of -49% in 2008. It’s no wonder the S&P 500 gets all the press.
Relative to the S&P 500, the Bloomberg Agg looks downright boring with an average intra-year drop of -3.2%. And over the past 45 calendar years from 1977 to 2021, it has never experienced an intra-year decline of -10% or greater. Granted it came close in 1980, down -9% intra-year and touched -7% intra-year in 1979 and 1994. But the 2022 intra-year decline of -14% for the Bloomberg Agg is almost 4.4-times greater than its average decline of -3.2% and 1.6-times greater than its worst year (1980) in this sample. Whereas the 2022 intra-year decline for the S&P 500 of -24% is only 1.7-times greater than its average decline of -14.0% and half of its worst year (2008) in this sample.
In summary, based on this 45-year data set (1977 to 2021), 2022 has debatably been par for the course for S&P 500 (stock) volatility but an outlier for Bloomberg Agg (bond) volatility.
Here is how they all stack up.
S&P 500 & Bloomberg Agg Comparison: 2022 YTD vs. 1980, 1979, 1994 & 2008
| Year | S&P Intra-Year Decline | Agg Intra-Year Decline | S&P Annual Return | Agg Annual Return |
| 2022 YTD | -24% | -14% | TBD | TBD |
| 1980 | -17% | -9% | 32% | 3% |
| 1979 | -10% | -7% | 19% | 2% |
| 1994 | -9% | -7% | 1% | -3% |
| 2008 | -49% | -5% | -37% | 5% |
Despite negative intra-year declines in stocks and bonds in 1980 and 1979, both indices posted positive annual returns. In 1994, both finished relatively flat. 2008 was cataclysmic for the S&P 500, but here the Bloomberg Agg provided shelter from equity volatility.
Crisis or not, we haven’t seen simultaneous intra-year drops in the S&P 500 and the Bloomberg Agg like this in over 40 years.
I would be remiss if I didn’t point out that we haven’t experienced comparable inflation as measured by the Consumer Price Index in over 40 years (since 1979 and 1980). To combat inflation, Jerome Powell and the Federal Reserve Board have implemented five rate hikes so far in 2022 totaling 300 basis points (bps) as outlined below:
- 25 bps (Mar-2022)
- 50 bps (May-2022)
- 75 bps (Jun-2022)
- 75 bps (Jul-2022)
- 75 bps (Sep-2022)
Based on the Fed’s current tone, more rate hikes are inevitable. While rising interest rates historically have a negative impact on bond prices, we haven’t seen yields this high on short-term treasuries in 15 years. Just 2 years ago, short-term interest rates were near 0%. The table below compares interest rates on short-term treasury issues on September 23, 2020, and September 23, 2022:
U.S. Treasury Yield Comparison: 2020 vs. 2022
|
|
Yield |
|
|
9/23/2020 |
9/23/2022 |
|
|
U.S. 3-Month Treasury |
0.09% |
3.20% |
|
U.S. 6-Month Treasury |
0.10% |
3.88% |
|
U.S. 1-Year Treasury |
0.12% |
4.10% |
|
U.S. 2-Year Treasury |
0.14% |
4.20% |
|
U.S. 3-Year Treasury |
0.16% |
4.22% |
|
U.S. 5-Year Treasury |
0.27% |
3.97% |
Source: Bloomberg
Today you earn just over 4% interest on 1-Year, 2-Year, and 3-Year U.S. Treasuries compared to basically nothing two years ago. It doesn’t hurt to mention that U.S. Treasuries are generally granted the highest possible credit rating. I acknowledge that it feels a bit like a double-edged sword. But just as rising interest rates historically have a negative impact on bond prices, they have a positive effect on forward bond returns. Said another way, money from maturing bonds can be reinvested into new bonds with higher yields and could increase a bond portfolio’s overall return.
And therein lies the opportunity (thank you Mr. Einstein).
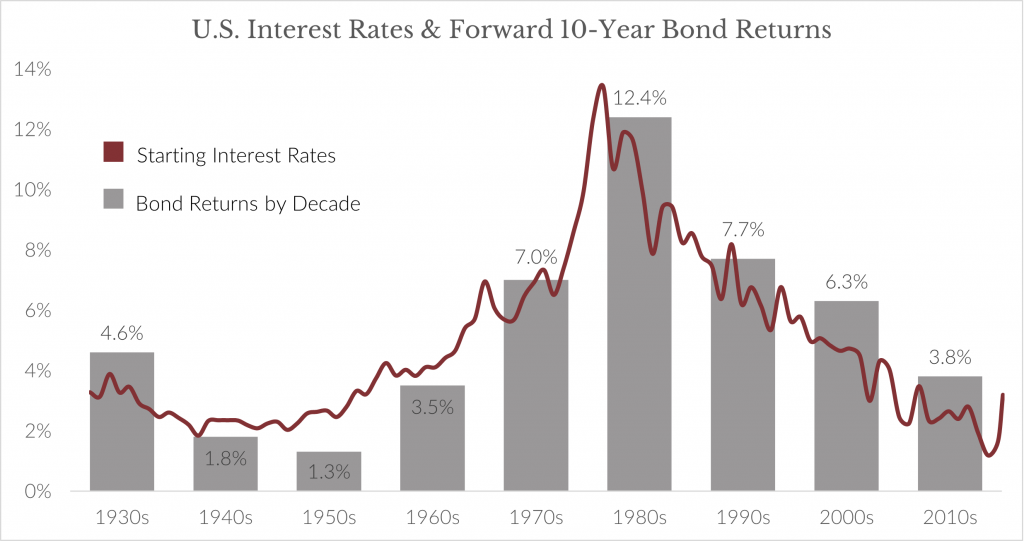
Source: Bloomberg
Bonds matter again in terms of cash flow generation in a diversified portfolio. That is a key point to remember in weathering times like these. As investors, we might not know what the value of our portfolio will be tomorrow in terms of market pricing. However, holding dividend-paying stocks, interest-paying bonds and distribution-paying alternatives like Real Estate Investment Trusts (REITs), Master Limited Partnerships (MLPs), Preferred Stocks and Closed-End Funds can give you consistent income that you can plan around, regardless of market conditions.
There is a storm out there, no doubt about it. You might feel like you are trapped in the center of it with no safe harbor in sight. If you are having trouble sleeping well at night, consider working with a trusted, qualified financial advisor to help you find the silver lining.
This information is provided to you as a resource for informational purposes only and is not to be viewed as investment advice or recommendations. Investing involves risk, including the possible loss of principal. There is no guarantee offered that investment return, yield, or performance will be achieved. There will be periods of performance fluctuations, including periods of negative returns and periods where dividends will not be paid. Past performance is not indicative of future results when considering any investment vehicle. This information is being presented without consideration of the investment objectives, risk tolerance, or financial circumstances of any specific investor and might not be suitable for all investors. There are many aspects and criteria that must be examined and considered before investing. Investment decisions should not be made solely based on information contained in this article. This information is not intended to, and should not, form a primary basis for any investment decision that you may make. Always consult your own legal, tax, or investment advisor before making any investment/tax/estate/financial planning considerations or decisions. The information contained in the article is strictly an opinion and it is not known whether the strategies will be successful. The views and opinions expressed are for educational purposes only as of the date of production/writing and may change without notice at any time based on numerous factors, such as market or other conditions.