The movie, “Rounders”, (1998) starring Matt Damon, Ed Norton and John Malkovich widely popularized the poker game known as “No-Limit Hold‘em”. In the culminating scene law school student Mike McDermott (Damon) defeats Russian mobster Teddy KGB (Malkovich) by going “all-in” on a $60,000 pot. He settles his and Worm’s (Norton) debts, drops out of law school, and leaves New York for Las Vegas to play in the World Series of Poker.
I can’t think of that scene without hearing Malkovich say to Damon in an exaggerated accent, “…and in in my club I vill (will) splash the pot venever (whenever) the (insert bad word) I please.”
If you are neither familiar with the movie nor the game Hold’em, here are the basics.
Each player is dealt two “hole cards”, face down, so that no player knows what the others are holding. Subsequently, five community cards are dealt face up in three rounds. The first round consists of three cards called, “the flop”, followed by the fourth card known as, “the turn”, and the fifth and final card referred to as, “the river”.
Each player uses their two “hole cards” and the community cards to make their best possible five card hand ranking from: Royal Flush (highest), Straight Flush, Four-of-Kind, Full House, Flush, Straight, Three-of-a Kind, Two Pair, One Pair, to High Card (lowest).
There are four rounds of betting; pre-flop, post-flop, turn and river where each player, in turn, may check (pass), bet, or raise any amount over the minimum raise and up to all the chips a player has in front of them known as an “all-in bet”.
Unfortunately, I can never seem to remember if a Flush beats a Straight which has led to my chagrin a time or two. But let’s not go there.
The real attraction to Hold’em, in my opinion, is that veteran players (“rounders”) make calculated decisions to check, bet, raise, or fold as the game progresses because mathematically they are dealing with a finite probability field. There are only 52 cards in the deck. As each card is dealt the probability of winning the pot changes for each remaining participant. On televised Hold’em tournaments the odds of winning for each player are recalculated as each round of betting unfolds. It’s fascinating to watch.
On the one hand, it is a game of risk. On the other hand, that risk is quantifiable as it relates to the probability of winning.
A parallel can be drawn to investment behavior considering that the spectrum of the investor mindset ranges from risk averse to risk seeking.
Risk averse investors prefer to take less risk for a more certain outcome albeit for a lower reward potential. Risk seeking investors conversely assume more risk for a less certain outcome in exchange for a higher potential reward.
Risk aversion to investing in the stock market can be amplified by the abundance of 24-7 outlets focused on day-to-day volatility, news headlines, opinion pieces, internet blogs all seemingly highlighting present and future uncertainty. How will financial markets be affected by Federal Reserve rate hikes, inflation, politics, bank failures, the debt ceiling, pandemics, natural disasters, wars? The wall of worry can be paralyzing and perhaps push risk averse investors to try to “time the market” by moving money into or out of stocks as opposed to taking a “buy-and-hold” approach regardless of market volatility.
It is difficult to tune out the noise.
In Hold’em, a player can use the estimated probability of success and reduced uncertainty as the game progresses to inform their decisions. As a self-professed poker novice, math nerd and data junkie, I challenged myself to see if similar logic applies to investing. Can the probability of market returns be calculated to better inform investment strategy? In my opinion, yes, while keeping the two caveats in mind:
- Past performance (historical data) is not indicative of future results.
- Future uncertainty (unlike a deck of cards) is essentially infinite (not finite).
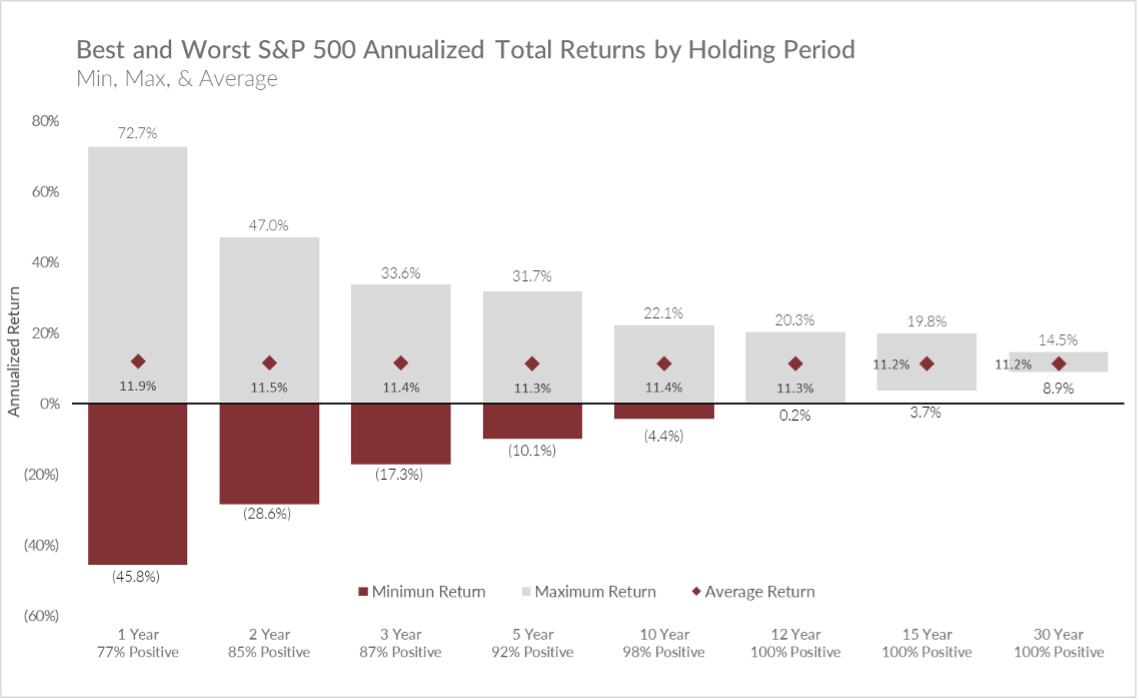
The chart below summarizes 87 years of S&P 500 Index data (S&P 500) from March 27, 1936, through March 24, 2023.
The bars represent the range of annualized total returns by holding period (as opposed to annualized return by calendar year). For example, a 1-Year holding period can be from July 15, 2019, to July 15, 2020, as opposed to a 1-Year calendar year from January 1, 2019, to January 1, 2020. The rationale for using the holding period is that investors can choose to invest at any point in time. They are not limited to investing only on the first day of any given calendar year.

Source: Bloomberg – As of 3/24/2023
Four data points are shown for each holding period:
- The maximum annualized total return
- The minimum annualized total return
- The average annualized return
- The positivity rate (the percentage of outcomes that have a positive rate of return)
Let’s take the 1-Year holding period as an example:
The maximum return for the S&P 500 was +73% (+72.7%) from March 19, 2020 (which was near the market bottom of the COVID pandemic), to March 19, 2021. Wow, what a return in a single year. I’ll take that action! If an investor was able to pull that off, they would feel pretty good about the prospect of making future investments. Now flip it and go into the market on March 6, 2008, and cut bait on March 6, 2009. This hypothetical unfortunate soul was down -46% (-45.8%) and after that experience would likely never consider investing in the stock market ever again. And who would blame them? Even though you have a 77% positivity rate for any 1-Year holding period from 1936 to 2023, the range of potential outcomes anywhere from down 46% to up 73% might not appeal to a risk averse investor.
But as we increase the holding period, we see three things happening:
- The positivity rate increases dramatically from 77% (1-Year) to over 90% (5-Year) to 100% (12-Year or more).
- The range of outcomes narrows significantly (getting smaller). From the 1-Year holding period to the 5-Year holding period, the dispersion between the minimum and maximum return contracts by 65% from down 46% | up 73% (1-Year) to a down 10% |up 32% (5-Year).
- The minimum is getting less and less negative and becomes positive at the 12-Year holding period (and beyond).
Now let’s analyze the 15-Year holding period:
The worst annualized return was about +4% (+3.7%) which was from September 8, 2000, to September 4, 2015. That might not sound so great but consider that this period included the “Dot.com” bubble burst (2000), the September 11th Terrorist Attacks & Enron (2001), The Iraq War (2003), Hurricane Katrina (2005), Bernie Madoff and the Global Financial Crisis (2008). All in, this specific period included two separate market declines of more than 45%. One might logically assume that the best annualized return of +20% (+19.8%) from August 6, 1982, to August 1, 1997, was a cakewalk. Not exactly as this period included Black Monday (1987) where the market dropped 33% in just 38 trading days as well as the Friday the 13th mini-crash (1989) and the 1990 Recession.
The point is that realizing either outcome (+4% or +20% annualized) required staying invested for the full 15-Year holding period.
And just in case you were curious about how the average inflation rate (measured by the Consumer Price Index “CPI”) compared to the minimum return during the 100% positivity rate periods, here is the data:
- 15-Year Minimum +3.7% | Average CPI 2.23% (9/8/2000 to 9/4/2015)
- 20-Year Minimum +4.3% | Average CPI 2.17% (3/19/2000 to 3/20/2020)
- 30-Year Minimum +8.9% | Average CPI 2.44% (3/20/1990 to 3/20/2020)
So even the minimum annualized return outperformed inflation for these holding periods.
Bottom Line:
The stock market, like poker, may feel like a gamble to some of us. Market risk is inherent in investing, there is no doubt about it. But the historical data presented here reflects that longer holding periods generally result in a more favorable outcome than shorter holding periods when it comes to returns and outpacing inflation. We can never fully remove uncertainty from investing. And while we cannot predict the future, I personally subscribe to the following sentiment:
“History may not repeat itself, but it often rhymes.” – Samuel Clemens (aka Mark Twain)
Simply meaning because we are humans, we exhibit certain behavioral patterns, and these patterns result in market cycles. And while the combination of today’s circumstances may not be exactly like a past period in our history, there are certainly similarities and conclusions we can draw from those analogues.
The key perspectives from this analysis are, as the holding period increases:
- The probability of having a positive market return generally increases.
- The range of returns from minimum to maximum contracts (narrows).
- The minimum return shifts upward (becomes less negative) eventually becoming positive.
By no means is there a one-size-fits-all approach to investing such as buy-and-hold vs. market timing. Everyone has their own unique set of circumstances, risk tolerance and time horizon. If you find yourself grappling with whether to hold or fold your investment strategy, consider working with a trusted, qualified investment advisor to help you find your balance.
This information is provided to you as a resource for informational purposes only and is not to be viewed as investment advice or recommendations. Investing involves risk, including the possible loss of principal. There is no guarantee offered that investment return, yield, or performance will be achieved. Stock prices fluctuate, sometimes rapidly and dramatically, due to factors affecting individual companies, particular industries or sectors, or general market conditions. For stocks paying dividends, dividends are not guaranteed, and can increase, decrease, or be eliminated without notice. Fixed-income securities involve interest rate, credit, inflation, and reinvestment risks, and possible loss of principal. As interest rates rise, the value of fixed-income securities falls. Past performance is not indicative of future results when considering any investment vehicle. This information is being presented without consideration of the investment objectives, risk tolerance, or financial circumstances of any specific investor and might not be suitable for all investors. There are many aspects and criteria that must be examined and considered before investing. Investment decisions should not be made solely based on information contained in this article. This information is not intended to, and should not, form a primary basis for any investment decision that you may make. Always consult your own legal, tax, or investment advisor before making any investment/tax/estate/financial planning considerations or decisions. The information contained in the article is strictly an opinion and it is not known whether the strategies will be successful. The views and opinions expressed are for educational purposes only as of the date of production/writing and may change without notice at any time based on numerous factors, such as market or other conditions,


