With the Dow, S&P 500 and Nasdaq all flirting with “correction territory”, it’s no wonder investors are on edge. I mean, what is there to worry about other than the next COVID variant and the geopolitical uncertainty between the United States, China and Russia? Oh, and did I mention that the 2nd year of the presidential cycle is historically the most volatile for the market? The market typically hates uncertainty, which we have plenty of right now.
Let’s review a familiar benchmark for the U.S. large-cap stock market in a way that provides some context for historical market volatility. The chart below shows the annual return (gray bars) versus the maximum intra-year decline (red dots) for the S&P 500 from 1928 through 2021:
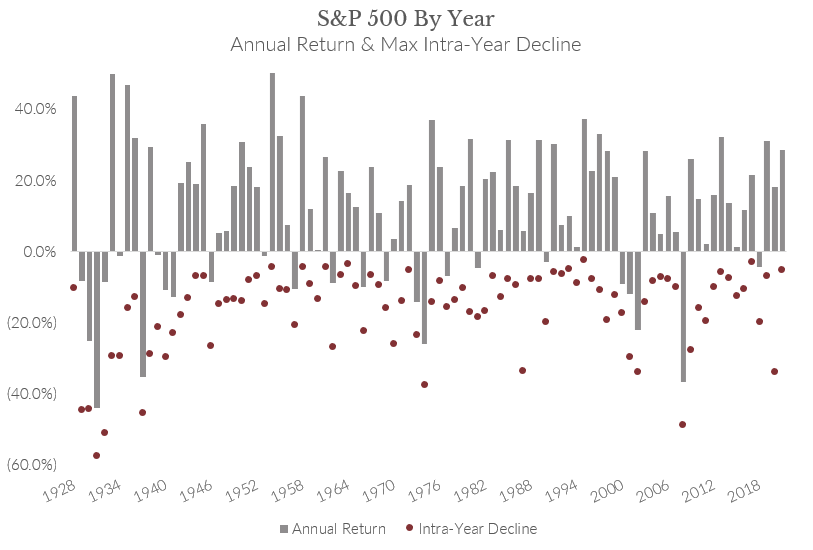
Source: Bloomberg; NYU Stern Database
Here are a few key takeaways from this dataset that I believe helps to put market volatility in perspective:
- In every single year, the S&P 500 experienced a negative drawdown.
- The drawdown over this 94-year period averaged -16.5%.
- 71% of the time (in 67 of the past 94 years), the S&P 500 posted a positive annual return despite the intra-year drawdown.
- Perhaps the most significant takeaway from this historical dataset is understanding that 100% of the time, the S&P 500 finished the year higher than its intra-year drawdown. In other words, the market pullback during the year was worse (lower) than the final market return for that year.
It’s also relevant to gauge the magnitude and frequency of market corrections. Here is a breakdown of how often the S&P 500 experienced a correction of -10% or more during the same 94-year period:
- Correction > -10% every 1.6 years
- Correction > -20% every 3.9 years
- Correction > -30% every 9.4 years
- Correction > -40% every 15.7 years
It’s natural to feel panic and the ensuing inclination to sell out of the stock market when we read scary headlines and see recent near-term gains erode from our portfolio in a matter of days. It takes both discipline and accepting market uncertainty to be a long-term investor, especially during volatile times.
And while my phone isn’t “ringing off the hook” in light of the recent market volatility, I’ve received a handful of emails from a few clients with subject lines like, “Correction or Crash?”…and “Yikes, markets really tumbled today.” Some included questions like, “How long do you think this downturn will last?”…or, “How much more will the market drop?” And my honest answer is, I don’t know. No one does.
I can however offer perspective based on decades of market data. While past performance is not always indicative of future results, it does provide a guideline.
After the COVID correction of 2020, I published an article on how investors can leverage dry powder in their portfolios to weather market storms. Today’s market environment is a great time to dust off and revisit this concept.
Dry powder refers to the necessity of using dry gunpowder during battle – think muskets and cannons.
“Put your trust in God, my boys, and keep your powder dry.” – General Oliver Cromwell
In finance, dry powder means the cash reserves a company or individual maintains to meet obligations in times of economic stress. At Capital Investment Advisors, dry powder equates to the various ways to fill your Cash (savings, money market, CDs) and Income (treasuries, municipal and investment-grade bonds) buckets.
Holding a diversified portfolio which includes a comfortable allocation to dry powder can help you better maintain discipline and sleep well at night when volatility strikes. Which brings us to the Dry Powder Principle (DPP).
The Dry Powder Principle says investors should hold at least three years of dry powder. Dry powder refers to safety assets within your portfolio.
The Dry Powder Principle is guided by two primary tenets:
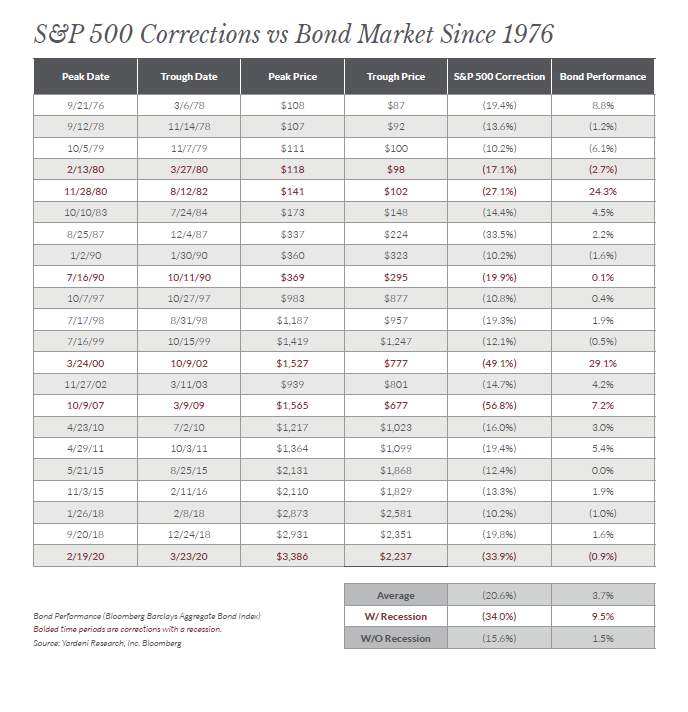
1. Generally, If Stocks Go Down, Bonds Go Up: Based on the historical data, your dry powder reserves (Cash and Income buckets) will generally be a better option to cover spending needs during a market pullback than your Growth and Alternative buckets. In the past 45 years during corrections of -10% or more, the average S&P 500 drawdown was -20.6% while bonds on average increased by +3.7%. In other words, during a downturn you would generally want to sell your bonds if you need cash. Reference Table 1: S&P 500 Corrections vs. Bond Market Since 1976
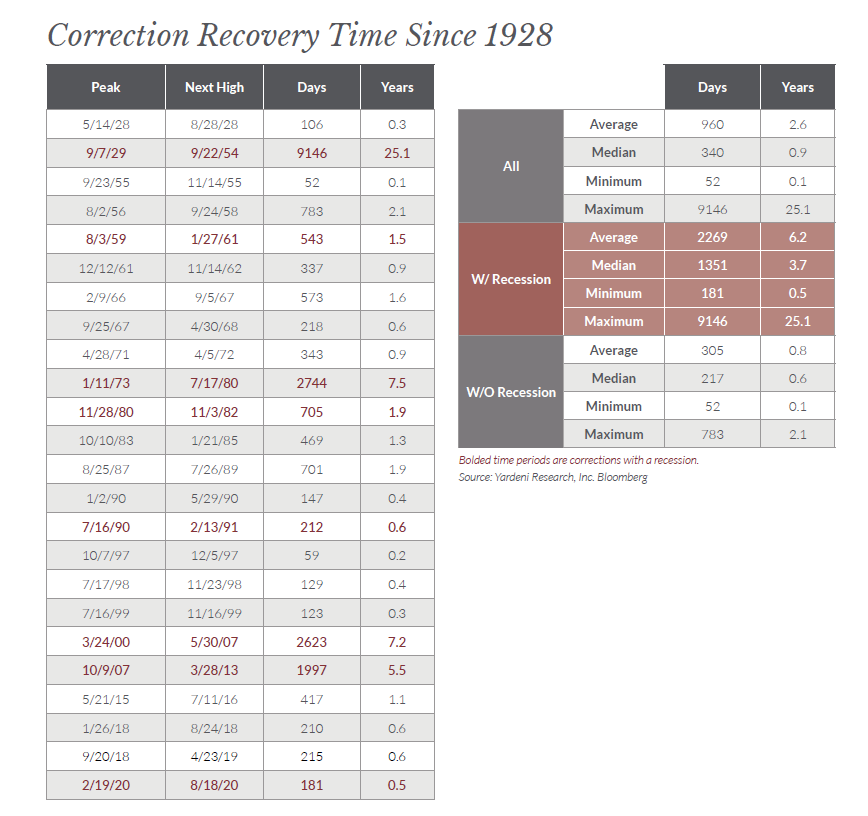
2. Start with Three Years of Dry Powder: In our opinion, investors who are close to or in retirement should have at least three years of dry powder in their portfolios. Why three years? Since 1928, the S&P 500 correction recovery time has averaged 2.6 years, so we rounded up to three. Reference Table 2: Correction Recovery Time Since 1928
Use the two steps below to calculate how much dry powder to hold in your Cash and Income buckets.
First, calculate your Annual Income Gap (IG):
Income Gap (IG) = Expenses (E) – [ Non-Portfolio Income (NPI) + Portfolio Income (PI) ]
Note:
- Expenses are your annual living expenses for food, home, auto, medical, charitable giving, travel, core pursuits (aka hobbies on steroids) and taxes.
- Non-Portfolio Income includes annual income from benefits such as Social Security, pensions, annuities, rental properties, deferred compensation, etc.
- Portfolio Income is the annual cash flow generated by your Income Investing buckets – dividends (Growth bucket), interest (Cash & Income buckets), and distributions (Alternative bucket).
Second, calculate how much you should have in Dry Powder (DP) by multiplying your Annual Income Gap (IG) by Three Years to Recover:
Your minimum amount of Dry Powder (DP) = Income Gap (IG) x 3 Years
Here are two practical applications of the Dry Powder Principle.
Eddie and Eva are in their mid-60’s. Both are newly retired and nervous about stock market volatility, inflation, politics and COVID variants. Their combined Social Security benefits total $38,000 per year. Eva has a teacher’s pension benefit of $12,000 per year. They spend about $9,125 per month, or $109,500 per year (Eva has the expense budget dialed in). Collectively, they have $750,000 in their retirement portfolio which generates about $17,000 per year in dividends, interest, and distributions.
If we do the math to first solve for their income gap:
Income Gap = $109,500 (E) – [$50,000 (NPI) + $17,000 (PI)]
Income Gap = $42,500
In accordance with Dry Powder Principle (tenet #2), Eddie and Eva use their annual income gap above to determine the minimum amount of dry powder required to span a three-year market recovery.
Minimum amount of Dry Powder = $42,500 (IG) x 3 Years to Recover
Dry Powder needed = $127,500
For Eddie and Eva this translates to a portfolio allocation with a minimum of 17% ($127,500 DP/ $750,000 portfolio) in their Cash and Income buckets and the remaining 83% balance in their Growth and Alternative buckets.
Adel and Bob are in their late-70’s. They can handle the volatility (for the most part), but this recent pullback has captured their attention. They want to know if they are ok. Their combined Social Security and pension benefits total $52,000 per year. They spend about $150,000 per year. Their retirement portfolio generates roughly $45,000 annually in dividends, interest, and distributions. They currently have $10,000 in emergency cash and $100,000 in treasuries and short-term investment grade bonds.
If we do the math:
Income Gap = $150,000 (E) – [$52,000 (NPI) + $45,000 (PI)]
Income Gap = $53,000
Adel and Bob have a total of $110,000 dry powder which is the sum of their cash ($10,000) and their treasuries and short-term investment grade bonds ($100,000). Are they aligned with the Dry Powder Principle?
No
DPP calculation = $110,000 (DP) / $53,000 (IG) which only equals 2.1 Years to Recover
Adel and Bob are about a year short. We would recommend rebalancing their portfolio to hold at least $160,000 in dry powder which gives them three years to recover.
As you can see, these numbers are subjective and can be customized to your unique set of circumstances and risk tolerance.
Bottom Line
Market risk is systemic, meaning it is inherent to the entire market. You can try to run from it, but you can’t hide. It’s hard to separate emotion from investing. Knowing precisely when to “get out” and “get back in” the market is impossible. Consistently predicting the timing, duration, and/or depth of the next correction is simply anyone’s guess, opinion, headline, or doomsday blogpost. As long-term investors, we acknowledge that volatility is normal, not abnormal. And implementing the Dry Powder Principle with an understanding of historical market uncertainty may provide the discipline and peace of mind you need to fight each bout of volatility the market throws your way.
Our team believes so strongly in this powerful investment principle, we created the “dry powder calculator.” This can help investors figure out how much dry powder they need and even help them understand how much dry powder they have in their overall portfolio. Click the button below to try out our online calculator.

This information is provided to you as a resource for informational purposes only and is not to be viewed as investment advice or recommendations. Investing involves risk, including the possible loss of principal. There is no guarantee offered that investment return, yield, or performance will be achieved. There will be periods of performance fluctuations, including periods of negative returns and periods where dividends will not be paid. Past performance is not indicative of future results when considering any investment vehicle. This information is being presented without consideration of the investment objectives, risk tolerance, or financial circumstances of any specific investor and might not be suitable for all investors. This information is not intended to, and should not, form a primary basis for any investment decision that you may make. Always consult your own legal, tax, or investment advisor before making any investment/tax/estate/financial planning considerations or decisions. Investment decisions should not be made solely based on information contained in this article. The information contained in the article is strictly an opinion and it is not known whether the strategies will be successful. There are many aspects and criteria that must be examined and considered before investing.