When it comes to investing, scary headlines can steal the spotlight and blind us to the reality of fundamental and historical trends. While copy editors may not agree, the true breaking news is that there is amazing power in simply understanding the average rates of decline and return for stocks over 10, 40 and even 100 years.
What’s important to remember about average rates is that while past performance is not a guarantee of future results, history can serve as a guide, particularly when it comes to the economy and stocks. This reliability means these powerful trends serve as a foundation for how and why we invest over longer periods of time. An example is the 10% Rule of Equity Markets per annum.
I refer to that 10% number as foundational because it does its job underneath the structure, out of our line of sight. The rest of the story, the above-ground portion, is the constant jeopardy, attack and doubt often triggered by the financial media.
There are two types of averages: the average correction in any given year and the average durability of the market in general. It’s important to understand each one.
The first one signifies the average intra-year (peak to trough) decline for stocks in any given year. It’s the “bad” average because no one likes to see their money decrease in value. JP Morgan regularly updates a bar chart on its website that takes 41 years’ worth of investing data and points out whether the market was up or down in a given year. Out of 41 years, 31 of them have been a net positive. But, even during those, we’ve seen drawbacks. In other words, market drops are normal.
The above-ground part of the structure is where all the drama unfolds. We constantly hear that markets are overvalued with near-daily concern for market corrections. A quick Google search reveals repeated warnings from seemingly smart people about impending doom.
In August of 2021, Morgan Stanley’s Mike Wilson said the S&P 500 could drop over 10% before the end of the year. In July of 2021, Scott Minerd from Guggenheim Partners lamented that U.S. stocks could plunge 15% in a very rough autumn. In June of 2021, Invesco’s Kristina Hooper cautioned that a broader market was vulnerable to a 15% correction because we were in a precarious period.
Aren’t we always in a precarious period?
What’s so interesting about these headlines is that they are far from brave predictions. Referring back to intra-year declines on our trusty JP Morgan chart, it’s pretty evident that these corrections happen often. Predicting one is a bit like the tarot card reader who sees “a challenge” at some point in your future.
In fact, if you look at the JP Morgan chart I mentioned earlier, over the 41 years it covers, you’ll see the market drops at some point every single year. I go back to the mid-’90s and see a negative 12%, a negative 17%, a negative 19%, even a negative 34%. You get the point.
We should expect a 10%-15% correction on average because it’s a natural part of how markets work. And that’s why a bespoke Wall Street analyst stating “I think we’re going to have a 10%-15% correction” just isn’t a gutsy prognosis. “Danger ahead” stories play right into our biological, ancestral fight-or-flight reaction. On average, in any given year, the S&P 500 is going to have an intra-year decline and the average is 14.3%. Use this to help you breathe through the tumult and drown out the talking heads.
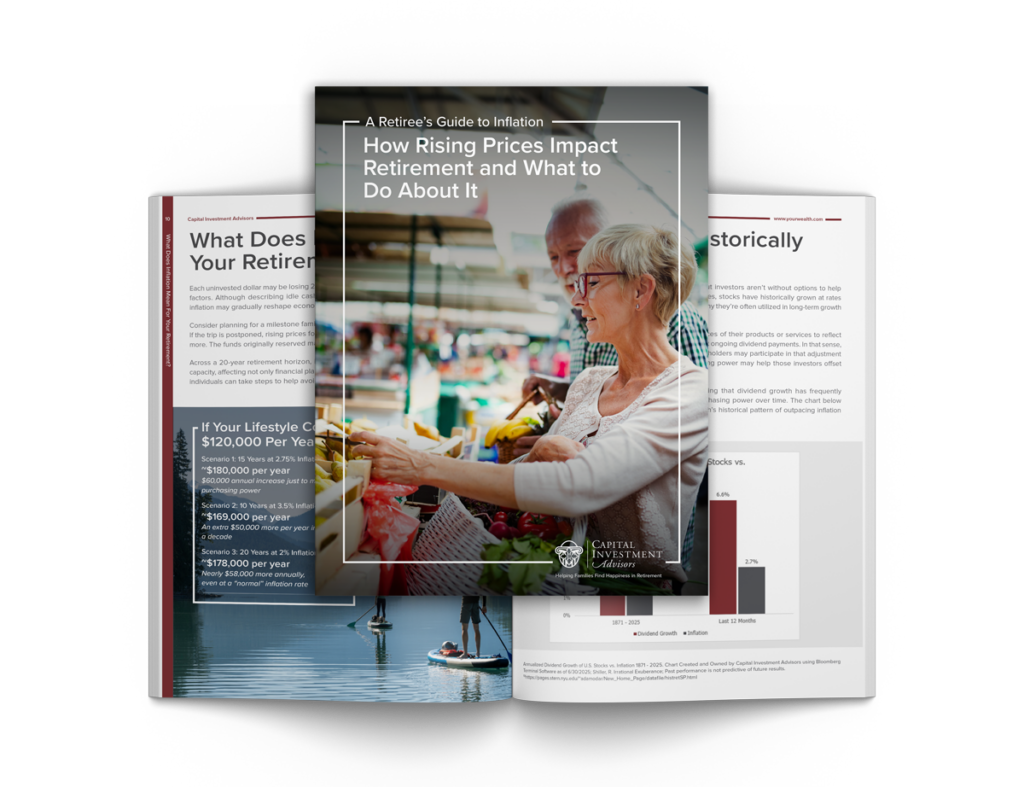
The next type of average is more pleasant to evaluate because it’s all about the market rising. Unfortunately, the sky makes more news when it falls than it does on its re-ascent. Lost amongst all the other headlines is a faint whisper about a 10% long-term average for stocks. Despite the lack of fanfare, that’s a pretty big deal considering bonds have averaged 6% and inflation has averaged 3%. A look at the S&P 500 dividend reinvested price calculator going back 100 years up until the second Friday of September 2021 shows it’s actually at 10.56%. Going back 95 years, the number is 10.3%; 50 years puts it at 10.97%. This means that year after year, the average is 10% per annum.
To put this into practice, as a reminder, the Rule of 72 shows how long it would take for your money to double with a certain rate of return. Take 72 divided by your average annual rate of return. In this case, that’s 10%, which means every 7.2 years, your money would double. If you had $100,000, it would become $200,000. If you had $5 million, it would be worth $10 million. Even though 10% may not sound flashy, it’s an incredibly powerful tool to help solidify your future happy retirement.
In case those time horizons look a little long and intimidating, let’s look at a shorter period. Take a 14-year stretch starting in October of 2007. It was the nastiest bear market (where prices fall by 20% or more) since the Great Depression. It was far worse than what we saw after 9/11. If we invested at the highest point, the S&P 500 was at 1,500. Then came a 56% correction. Brutal. Oh, and by the way, there were three more bear markets after that — 2011, 2018 and that negative 34% in 2020 due to the COVID-19 pandemic. Sounds catastrophic but as I write this, the S&P 500 is right around 4,400. So, let’s do that math. From 1,500 to 4,400, we get an 8% average annual rate of return from a price perspective. Then, factoring in the dividend, as well as compound reinvested dividends, that adds 2% per year to that 8% number. Suddenly, we’re back to our trusty 10%. What this shows is that even when investing in bad timing, over the duration, there isn’t all that much difference in your end dollar amount.
Market corrections and even bear markets are coming. It’s cyclical and natural. But buying into the barrage of scary headlines and doubting the army of American productivity don’t help you plan for your future. I understand that averages aren’t sexy, but they are durable, dependable and effective. The naysayers won’t stop talking, so it’s up to you to turn down the volume.
Confidence and optimism about the future, buttressed with knowledge about the past and a healthy dose of patience for capitalism to function consistently in the United States, is a great way to navigate a turbulent market.
Read the AJC Article here.
Disclosure: This information is provided to you as a resource for informational purposes only. It is being presented without consideration of the investment objectives, risk tolerance or financial circumstances of any specific investor and might not be suitable for all investors. Past performance is not indicative of future results. Investing involves risk including the possible loss of principal. This information is not intended to, and should not, form a primary basis for any investment decision that you may make. The information contained in this piece is not considered investment advice or recommendation or an endorsement of any particular security. Further, the mention of any specific security is solely provided as an example for informational purposes only and should not be construed as a recommendation to buy or sell. Always consult your own legal, tax or investment advisor before making any investment/tax/estate/financial planning considerations or decisions.