
Understanding the Form 1040, Taxable Income, and Why Most People Misunderstand How Taxes Actually Work
Regina called me in a tizzy and asked if we could jump on a Zoom call.
She and her husband, Dallas, are in their mid-70s. Over the past few years, they had accumulated nearly $200,000 in emergency savings while interest rates were on the rise. Like many retirees, they wanted safety, liquidity, and peace of mind.
But now rates had risen. Their cash was finally earning something meaningful again. And that created a new concern.
“I don’t want to pay 22% taxes on this interest income,” Regina said. “Maybe we should just buy municipal bonds since they’re tax-free.”
I acknowledged her concern, but I also knew something felt off.
So I said:
“Let’s hit pause for a second and back up.”
“First of all, I do not believe you are in the 22% bracket unless something has fundamentally changed since our last conversation.”
Silence.
Her camera was on. I could see the blank stare and confusion on her face.
Then it hit me.
She thought her tax bracket was based on her Adjusted Gross Income (AGI).
And honestly? A lot of people think that.
Taxes are confusing. The Form 1040 is confusing. Marginal tax brackets are confusing. Sometimes those of us who work around these things every day forget that most people only look at their tax return once a year, hand it to their CPA, sign where they are told to sign, and move on with life.
I asked Regina to grab her filed 2025 tax return.
“Look at Line 11,” I said.
“What number do you see?”
“About $105,000,” she replied.
“And that,” she said confidently, “puts us in the 22% bracket.”
Not exactly.
That number was their adjusted gross income or “AGI”. Your AGI is income for the year after you subtract amounts – or “adjustments” – that are not taxable.
But your marginal tax bracket is not based on your AGI.
It is based on your taxable income.
That distinction matters more than most people realize.
The Crash Course: How the Form 1040 Actually Works
Here is the simplified version.
On your Form 1040:
- Line 11 is your AGI
- Then you subtract either your standard deduction or your itemized deductions (Line 12e)
- After those deductions, you arrive at Line 15:
- Taxable Income
That taxable income number determines your marginal tax bracket.
For Regina and Dallas, their AGI was roughly $105,000.
But after deductions, their taxable income was only about $59,000.
Meaning?
They were not in the 22% bracket. They were in the 12% bracket.
That realization completely changed the conversation.
The Biggest Misunderstanding About Tax Brackets
One of my favorite explanations of tax brackets comes from Jason Toole, CPA, who I jokingly refer to as “the ultimate tax tool.”
Jason explains tax brackets like buckets.
And honestly, it is one of the best explanations I have ever heard.
We all start in the 10% bucket.
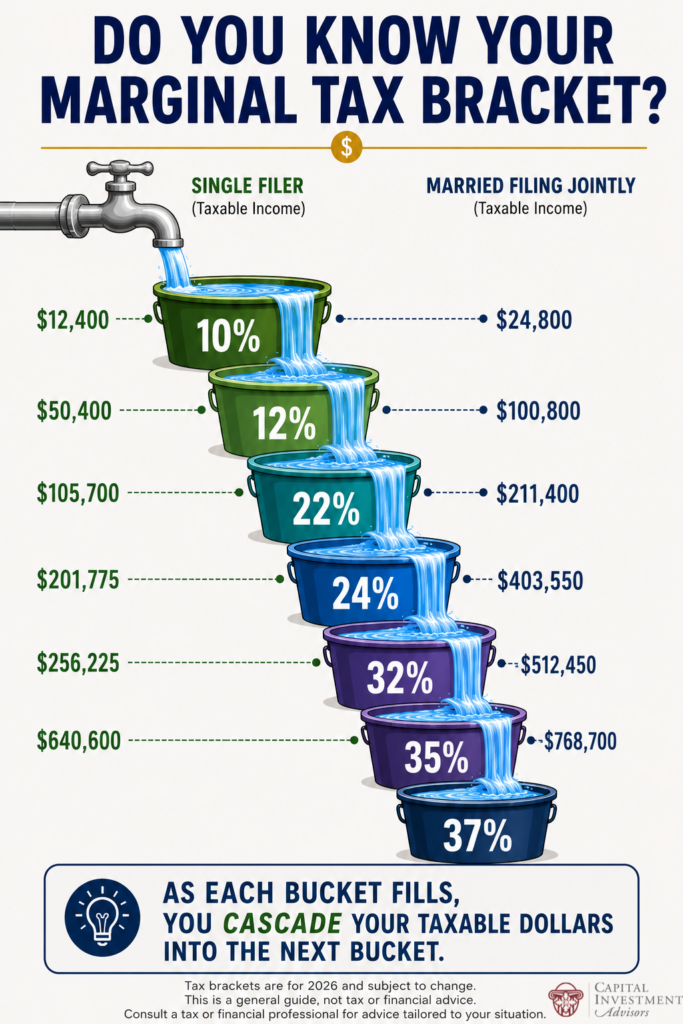
For married couples filing jointly in tax year 2026, the first $24,800 of taxable income fills the 10% bucket.
Once that bucket fills, the next dollars spill into the 12% bucket. Then the 22% bucket. Then the 24% bucket. And so on.
That does not mean all of your income is taxed at your highest bracket.
Only the dollars inside that bucket are taxed at that rate.
That is the part many people miss.
If your taxable income barely crosses into the 22% bracket, it does not suddenly mean every dollar you earned is taxed at 22%.
Only the dollars above the 12% threshold are taxed at 22%.
That distinction is incredibly important for retirement planning, Roth conversions, IRA withdrawals, capital gains planning, and investment strategy.
Here’s an example to crystallize this:
- Jack and Jill are married filing jointly. Their taxable income is $250,000. Their ordinary income tax is calculated like this:
- 10% x $24,800
- + 12% x ($100,800 – $24,800)
- + 22% x ($211,400 – $100,800)
- + 24% x ($250,000 – $211,400)
- = $45,196 (24% marginal bracket and an effective rate of 18.1%).
- Now, let’s say Jill is flying solo with the same taxable income. Jill is filing single. Her taxable income is still $250,000. Her ordinary income tax is calculated like this:
- 10% x $12,400 +
- + 12% x ($50,400 – $12,400)
- + 22% x ($105,700 – $50,400)
- + 24% x ($201,775 – $105,700)
- + 32% x ($250,000 – $201,775)
- = $56,456 (32% marginal bracket and an effective rate of 22.6%).
Pause there for a second. Same taxable income, two different outcomes. Jack and Jill, married filing jointly, are in the 24% bucket with a total ordinary income tax of $45,196, which is effectively 18.1% of their taxable income. But Jill, as a single filer on the same taxable income, is paying almost 25% more in taxes at $56,456, which is effectively 22.6% of her taxable income. Now I’m not suggesting Jill should walk up the hill and find a spouse to lower her taxes, but in fairness, her spouse might contribute more to the taxable income than a pail of water.
The Municipal Bond Conversation
Once Regina understood they were actually in the 12% bracket, her next question was:
“Well… shouldn’t municipal bonds still be better because they are tax-free?”
Not necessarily.
Again, context matters.
We pulled up current CD rates and compared them to a comparable duration broad municipal bond ETF.
The CD was paying around 4%.
Now remember:
If you are in the 12% marginal bracket, paying taxes on a 4% CD still leaves you with roughly:
4% x (1.00 – 0.12) = 3.52%
So after taxes, the CD was still netting about 3.5%.
Meanwhile, the municipal bond ETF was yielding around 3.4% tax free.
In other words:
The supposedly “tax-free” option was actually producing less income.
Not dramatically less. But less is less.
On $200,000:
- A CD at 4% would generate roughly $8,000 of interest annualized.
- After 12% taxes, net income was just over $7,000
- The municipal bond ETF at 3.4% would generate about $6,800
We might be picking nits over $200, but more is more.
The lesson here is simple:
You cannot determine whether municipal bonds make sense until you understand:
- Your marginal tax bracket
- Your after-tax yield
- Comparable market rates
- Your overall goals
Then the Conversation Got More Interesting
Regina paused and said:
“James… we probably do not even need $200,000 sitting in emergency cash.”
Now we were asking a different question.
Not: “How do we minimize taxes?”
But: “What is the best long-term use of this money?”
That is a very different conversation.
I explained that cash has stability, but very little long-term upside.
Stocks carry volatility, but they also offer growth potential and another tax advantage many retirees overlook:
Qualified dividend-paying stocks.
Qualified dividends are not taxed using ordinary income tax brackets.
They are taxed using long-term capital gains brackets, which range from 0% up to 20% versus 10% to 37%.
That surprised her.
Understanding the Capital Gains Tax Bracket
Most people know ordinary income has tax brackets. Fewer people realize long-term capital gains have their own tax brackets.
For married couples filing jointly in 2026, long-term capital gains fall into the 0% bracket up to approximately $98,900 of taxable income.
That means if Regina and Dallas had taxable income of $59,000, they still had substantial room remaining inside the 0% capital gains bracket.
So let’s say hypothetically that $200,000 invested in qualified dividend-paying stocks, yielding approximately 3% annualized, produces about $6,000 annually.
Add that $6,000 to their existing taxable income:
$59,000+$6,000 = $65,000
Still below the 0% long-term capital gains threshold.
Meaning:
Those qualified dividends could potentially be taxed at 0%.
Now obviously, investment decisions should never be made based solely on taxes. Risk matters. Liquidity matters. Goals matter.
But for Regina and Dallas, the conversation evolved from, “How to pay less in taxes?” into, “How do we build a portfolio that aligns with our goals while also being tax efficient?”
That is a much better planning conversation.
Then Came Donna and Andy
I got an email from Donna and Andy.
Andy is in his mid-70s. Donna is in her mid-60s.
They needed to take an additional IRA distribution to cover a major roof repair.
Their concern was simple:
“If we take this extra withdrawal, will it push us into a higher tax bracket?”
I called Andy, and like Dallas and Regina, we started with their filed Form 1040 from Tax Year 2025.
Not guesses. Not fear. Not headlines. Numbers.
Their 2025 return showed:
- An AGI around $80,000
- Taxable income around $34,000
That distinction mattered enormously.
After projecting their:
- Social Security income
- RMD withdrawal
- Standard deductions
- Senior deductions
- Proposed roof distribution from Andy’s IRA account
They still remained inside the 12% marginal bracket.
That knowledge changed everything.
Instead of operating from anxiety, they could make an informed decision.
Why This Matters
I think taxes create fear because most people do not understand the system.
And honestly, that is understandable.
The tax code is complicated.
But the basics are not impossible to learn.
Understanding:
- AGI
- taxable income
- deductions
- marginal brackets
- capital gains brackets
…can completely change the quality of your financial decisions.
This is especially true in retirement when decisions about:
- IRA withdrawals
- Roth conversions
- Social Security
- investment income
- dividend strategy
- capital gains
- Medicare planning
…all begin interacting with one another.
Final Thoughts
I am not a CPA.
And nothing in this article should be interpreted as individualized tax advice.
But I do believe financial literacy matters.
I also believe many people make financial decisions based on misunderstandings of how taxes actually work.
Sometimes the first step is simply slowing down, opening the Form 1040, and understanding what the numbers actually mean.
Because once you understand how the buckets work, the tax code starts becoming a little less intimidating.
And a little more strategic.
Want to Know Where You Actually Stand?
If this article made you want to pull out your own Form 1040 and run through the numbers, that’s a great instinct. Understanding your taxable income, your marginal bracket, and how retirement income sources interact is exactly the kind of planning that can help inform financial planning.
We work with retirees and pre-retirees every day who are making important decisions about IRA withdrawals, Roth conversions, Social Security timing, and investment income — often without a clear picture of where they fall in the tax brackets. A single conversation can bring additional clarity.
If you have any questions or if you’d like to review your own tax picture and talk through what it means for your financial plan, we’d be glad to help. Schedule a complimentary conversation with our team.
This information is provided to you as a resource for informational purposes only. This information is not intended to, and should not, form a primary basis for any decision that you may make. This information is not a specific recommendation, individualized tax, legal, or investment advice. Tax laws are subject to change, either prospectively or retroactively. Where specific advice is necessary or appropriate, individuals should contact their own professional tax and investment advisors or other professionals to help answer questions about specific situations or needs prior to taking any action based upon this information. Any examples discussed are provided for illustrative purposes only. Individual situations will vary. The views and opinions expressed are for educational purposes only as of the date of production and may change without notice at any time based on numerous factors.