Fortifying Your Portfolio Through the Eyes of an Engineer
What Would Make You More Uncomfortable?
Paying taxes on a portion of your recent gains?
Or watching those gains evaporate in the next market correction?
If the first feels uncomfortable, you are not alone.
In some situations, realizing gains strategically can be part of a disciplined long-term plan designed to strengthen portfolio resilience.
Now consider the alternative.
2022: When There Was Nowhere to Hide
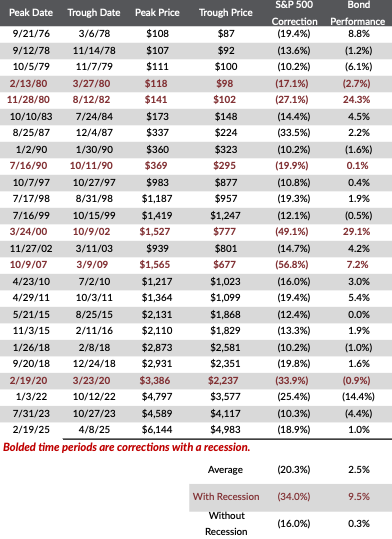
In 2022 there was nowhere to hide. (Reference Table 1)
We experienced a bear market in both stocks (25.4%) and bonds (14.4%). The traditional 60/40 portfolio appeared broken. Federal Reserve Chairman Jerome Powell aggressively hiked interest rates in an effort to combat inflation.
Rates up. Bond prices down. Red on the screen.
On the surface it looked like bonds failed.
But something important was misunderstood.
If you owned individual high-quality bonds and held them to maturity, you still received your principal back at par. The temporary price decline did not permanently impair the bond itself.
That is very different from owning bond mutual funds or exchange traded funds (ETFs), where there is no maturity date and no contractual return of principal.
Structure matters.
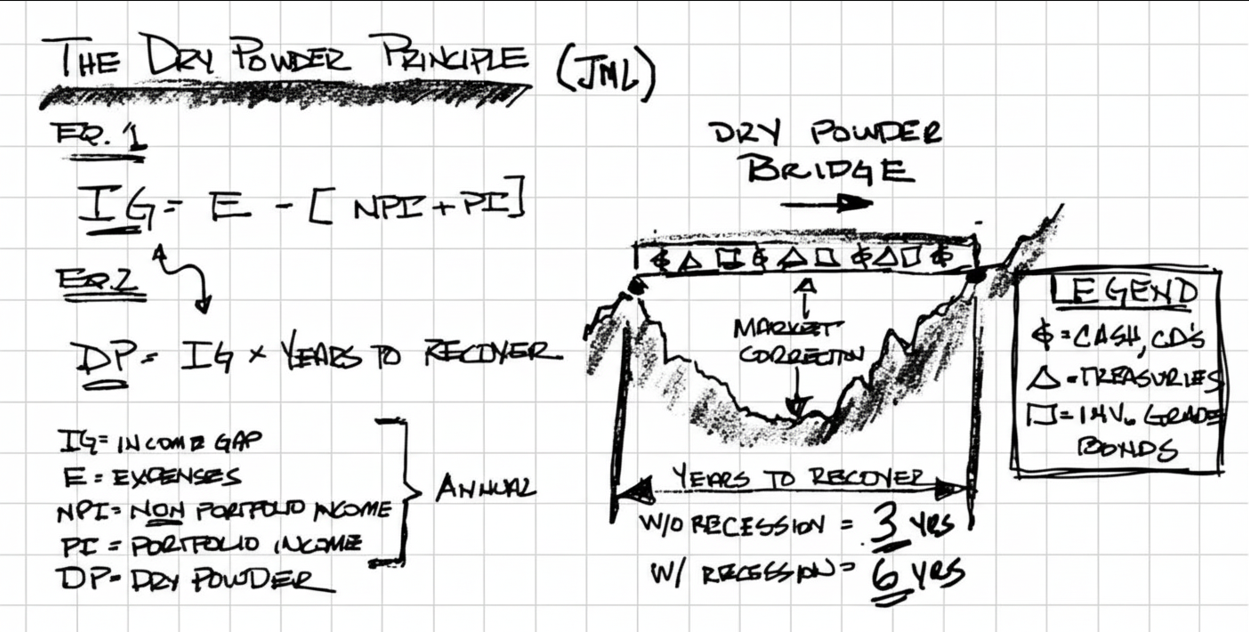
That period reinforced why we advocate for bond ladder strategies and why we emphasize what I call the Dry Powder Principle.
Make Hay While the Sun Is Shining
Today feels very different.
The S&P 500 and Dow have flirted with 7,000 and 50,000 respectively in early 2026.
The 10-year Treasury has hovered near 4%.
At a 4% yield, treasuries currently exceed the dividend yield of approximately 90% of the companies that make up the S&P 500. (Source: Bloomberg; Capital Investment Advisors, LLC calculations; as of 2/17/2026)
When portfolios are near all-time highs, discipline is paramount.
Dry powder is not built during panic.
It is built during prosperity.
Market Corrections and Retirement Portfolio Risk Are Rhythmic, Not Rare
Market volatility is not an anomaly. It is a feature.
Since 1928, the S&P 500 has historically experienced market corrections of varying magnitudes at the following average frequencies:
- A decline of more than 10% about every 1.7 years
- A decline of more than 20% about every 4.5 years
- A decline of more than 30% about every 7.5 years
- A decline of more than 40% about every 14 years
Source: Yardeni Research; Capital Investment Advisors, LLC calculations; Since 1928; Past performance does not indicate future results.
Here is how long it has been since each occurrence:
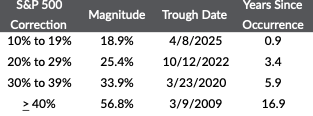
Source: Yardeni Research; Capital Investment Advisors, LLC calculations; Since 1928; Past performance does not indicate future results.
The exact dates matter less than the pattern.
Corrections happen. Recoveries follow.
The real risk is being forced to sell during volatility.
Peak to Trough Is Not the Real Risk
Most investors focus on how deeply markets fall.
I focus on how long they take to recover.
Since 1928, the average S&P 500 recovery time from its relative high back to prior peak has been approximately 2.6 years. We round that up to three years. (Reference Table 2)
During recessions, recovery periods have historically extended closer to 5.9 years which we round up to six years. (Reference Table 2)
That distinction matters.
If you are forced to sell equities during a downturn, you lock in losses and increase sequence of returns risk (the risk that poor early returns in retirement permanently reduce your sustainable withdrawal rate).
Dry powder gives you time.
Time to allow equities to recover.
Time to avoid emotional decisions.
That is the purpose of dry powder.
How to Calculate Your Dry Powder
The process is straightforward. Keep in mind this is an illustrative framework, not a rule, and should be tailored to your situation with a qualified financial advisor.
Step One: Calculate Your Annual Income Gap
You begin by determining how much of your lifestyle depends on selling securities. Your Income Gap estimates how much of your annual spending must come from withdrawing principal rather than income sources.
The formula is:
Income Gap (IG) = Expenses (E) − [ Non Portfolio Income (NPI) + Portfolio Income (PI) ]
- Expenses are your total annual living costs including food, home, auto, travel, healthcare, taxes, giving and core pursuits.
- Non-Portfolio Income includes Social Security, pensions, annuities, rental income, deferred compensation, etc.
- Portfolio Income includes stock dividends, bond interest and distributions generated from your investment portfolio.
In simple terms, your Income Gap is the amount you must withdraw from principal each year. That number represents your vulnerability during a downturn.
Step Two: Multiply by Years of Dry Powder
Once you know your Income Gap, multiply it by a recovery window.
At minimum, we use three years as a starting point based on historical average recovery times.
Dry Powder (DP) = Income Gap (IG) × 3 Years
That gives you a three-year retirement income bridge.
An Example
Jason and Christina are in their early 70’s.
Jason receives a pension of $17,000 per year. Their combined Social Security benefits total $33,000 per year. They spend approximately $150,000 per year ($12,500 per month). Their $1.1MM portfolio generates $33,000 per year in dividends and interest.
Here are the inputs:
Annual Expenses: $150,000
Non-Portfolio Income: $50,000
Portfolio Income: $33,000
Now apply the formula.
Income Gap = 150,000 (E) – [ $50,000 (NPI) + $33,000 (PI) ]
Income Gap = $67,000
They must withdraw $67,000 per year from principal.
If they want to span a three-year market recovery period:
Dry Powder = $67,000 (IG) x 3 Years to Recover
Dry Powder = $201,000
$201,000 represents 18% of their $1.1MM portfolio ($201,000 DP / $1.1MM portfolio) which they can hold in a mix of high quality, lower volatility assets such as laddered short-term investment grade bonds, laddered Treasuries, or other cash-like fixed income investments, depending on their situation and preferences.
If they prefer a six-year cushion:
Dry Powder = $67,000 (IG) x 6 Years to Recover
Dry Powder = $402,000
That represents approximately 37% of the portfolio.
The number is personal.
The framework is disciplined.
An Engineer’s Perspective
Before wealth management, I was a structural engineer.
I designed buildings in coastal environments exposed to hurricanes.
In engineering, we do not build for average conditions. We build for stress loads.
We assume the storm will come.
We assume the pressure will test the integrity of the structure.
You do not build a house out of straw and upgrade to brick when the hurricane warning hits.
You design the structure to withstand the storm.
Financial markets operate the same way.
Volatility is a stress load.
Dry powder is structural reinforcement for your portfolio.
It is a factor of safety.
It is resilience.
It is time.
And time is what turns market declines from permanent damage into temporary disruption.
Once More Unto the Breach, Dear Friends
Market corrections are not the end of the story. They are when preparation proves its value.
When volatility strikes, most investors retreat. They reduce exposure. They freeze.
With dry powder in place, you step forward deliberately.
You rebalance into equities when valuations compress.
You deploy capital methodically.
You act with preparation rather than emotion.
No one can consistently predict when volatility will strike. If you have met that person, send them my way.
Until then, I accept the inevitable.
Markets correct.
Markets recover.
Dry powder ensures that when the next breach appears, you enter it positioned, not panicked.
Final Thought
The Dry Powder Principle is not defensive in spirit.
It is disciplined in design.
It allows you to pursue long-term growth while protecting your near-term lifestyle.
And most importantly, it ensures that when volatility inevitably returns, you are not reacting.
You are prepared.
Our team believes so strongly in this powerful investment principle, we created the “dry powder calculator.” This can help investors figure out how much dry powder they need and even help them understand how much dry powder they have in their overall portfolio. Try Our Dry Powder Calculator
TABLE 1: S&P 500 Corrections vs. Bond Market Since 1976
 Bond Performance (Bloomberg Barclays Aggregate Bond Index)
Source: Bloomberg; Capital Investment Advisors, LLC calculations; 1/1/1976 to 12/31/2025; Bond Performance shown above is Bloomberg Barclays U.S. Aggregate Bond Index. Past performance does not indicate future results. Peak-to-trough measures the total percentage decline of the market, as measured by the S&P 500 from its highest point (peak) to its lowest point (trough).
TABLE 2: Correction Recovery Time Since 1928
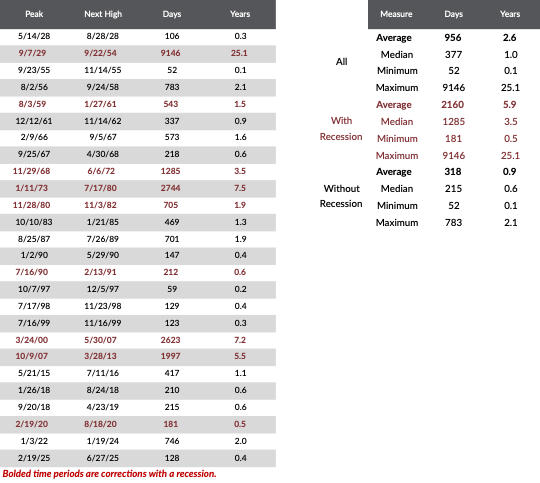 Source: Yardeni Research; Capital Investment Advisors, LLC calculations; 1/1/1928 to 12/31/2025. Past performance does not indicate future results.
Actual future recovery periods may be shorter or significantly longer than these historical averages.
Important Disclosures:
This material is for informational and educational purposes only and should not be construed as personalized investment advice or a recommendation to buy or sell any security. All examples are hypothetical and for illustrative purposes only.
References to market returns (including the S&P 500, Dow Jones Industrial Average, Treasury yields, and historical correction data) are based on third-party sources believed to be reliable but are not guaranteed as to accuracy or completeness. Historical averages, recovery periods, and correction frequencies are provided for context and do not imply that similar patterns will occur in the future. Past performance is not a reliable indicator of future performance.
The S&P Index measures the broad US stock market. The Bloomberg Barclays U.S. Aggregate Bond Index is a broad benchmark that measures the performance of the U.S. investment-grade taxable bond market. Indexes are unmanaged and cannot be invested in directly.
The “Dry Powder” framework is a conceptual planning tool and may not be appropriate for all investors. Maintaining “dry powder” may reduce portfolio volatility but may also limit upside participation during rising markets. Over time, the purchasing power of cash holdings, a common form of dry powder, can diminish due to inflation. Actual portfolio allocations should be based on individual financial circumstances, objectives, and risk tolerance.
The “Dry Powder Calculator” is provided for educational purposes only and does not constitute a financial plan or advisory recommendation.
Investing involves risk, including possible loss of principal. Bond investments are subject to interest rate risk and market risk. Individual bonds held to maturity are subject to issuer credit risk. Bond mutual funds and ETFs are subject to market fluctuations and do not have a stated maturity date. Dividend yields and Treasury yields fluctuate and are not guaranteed.